Intelligence
We invite you to browse our curated collection of insights and analysis — all developed by LNW team members.
Our Featured Content

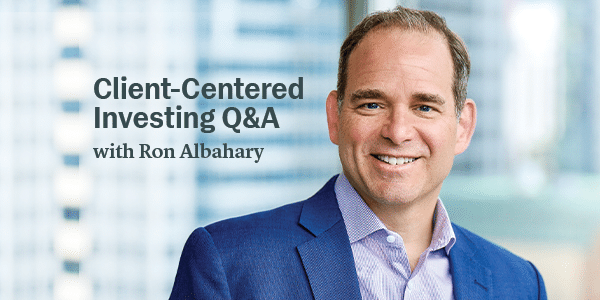
Commentary Q2 2024: Beyond the Market as Monolith
With geopolitical and economic risks both increasing, LNW CIO Ron G. Albahary, CFA® explains how we are taking advantage of the differentials among and within markets and asset classes to keep portfolios on course. Click here for the Executive Summary or download full paper below.

How We Work with Co-Trustees
We have a distinct advantage working with co-trustees because we tend to have existing relationships not only with our clients, but also their family members and their outside advisors.” – Kristi Mathisen, JD, CPA, PFS Trusts at LNW are built on relationships that grow and are reinforced over time. One of the key relationships we

Raising Money Wise Kids: Our Best Advice for Ages 3 – 18
Parents are the biggest “influencers” when it come to how their kids think about money and financial matters, a bevy of studies show. Even in the teenage years, kids say they would turn to mom or dad for financial advice over their teachers and friends. Many parents realize this to various extents, but how make

Over the weekend, the conflict in the Middle East reached a dangerously higher level. Iran launched an estimated 300 drones, ballistic and cruise missiles targeting Israel. Th

— U.S. consumer inflation ticked up in March to an annualized rate of 3.5% (3.8% excluding food and energy). The Fed is generally not expected to lower interest rates in
— The U.S. economy added a robust 303,000 new jobs in March and unemployment fell to 3.8%; job market strength makes it harder for Fed to lower interest rates. —

With U.S. stock markets near record highs, what we are doing to reduce risk. By David Baker, Senior Director, Investment Strategy and Communications.

Assets that appear most attractive to us on a risk-adjusted basis are those that help diversify equity risk.
— The U.S. economy grew a strong 3.4% annualized in 4th quarter 2023 (per latest estimate); a slowdown to 2.1% is expected for 1st quarter 2024. – U.S. manufactu
To his work as CIO of LNW, Ronald G. Albahary, CFA® brings more than 30 years of experience managing portfolios for high-net-worth and ultra-high-net-worth clients and
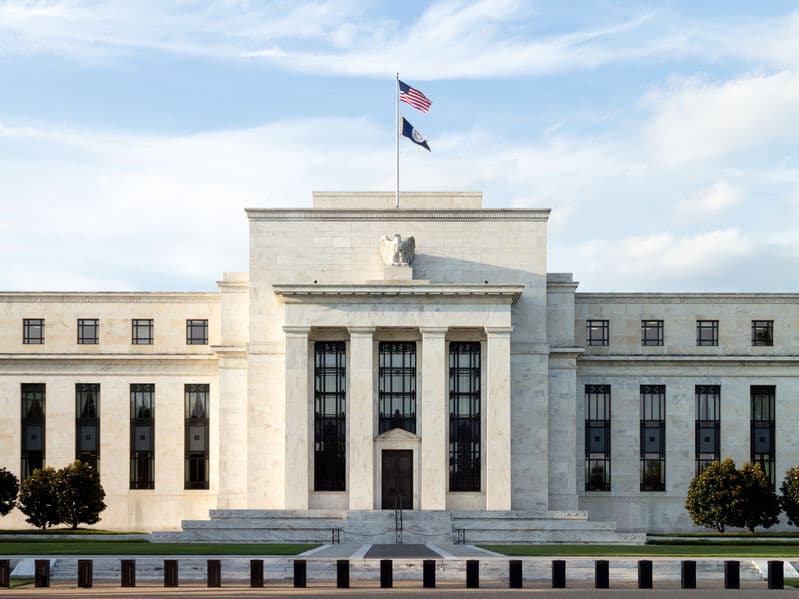
“Inflation is still high. The ongoing progress in bringing it down is not assured and the path forward is unsure.” — Fed Chair Jerome Powell, March 20 Press
— Federal Reserve holds rates steady and maintains three cuts coming sometime this year. — February home sales spike 9.5%, the largest monthly gain in a year, as s

